You must login before you can run this tool.
You are here: resources › Tools › ViewStruct › About
ViewStruct
A tool for visualizing crystal structures
Version 1.1 - published on 09 May 2014
This tool is closed source.
Category
Published on
Abstract
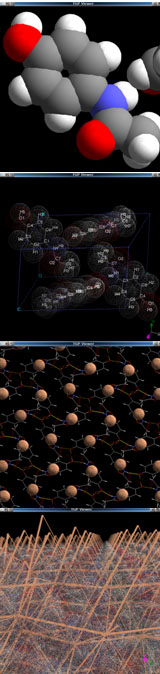
ViewStruct is a program that visualizes crystal structures and that can calculate and visualize the corresponding crystal graph. A file transfer feature allows cif files to be uploaded from the desktop for visualization with ViewStruct. Example files for acetaminophen and griseofulvin are available on-line. Downloads and documentation are also available on pharmaHUB.
The crystal graph is a formalization that stems from the Hartman–Perdok (HP) theory [3, 4, 5]. HP theory addresses crystal growth and is particularly useful to predict crystal morphology. In HP theory those elements that take part in the process of crystal growth are called growth units. Growth units are typically ions when salt crystals are formed and they are typically single molecules when molecular crystals are concerned. In essence the crystal graph describes the energies of interactions between these growth units. When drawn in the unit cell, the directionality of the interactions becomes apparent. Also, the cooperative effect of the different interactions in their 3-dimensional arrangement becomes visible when a crystal graph is drawn. The crystal graph can be used to assess the (an)isotropy of the crystal structure, slip planes, and ultimately the morphology and growth mechanisms [1, 2].
References
[1]P Bennema, H Meekes, SXM Boerrigter, HM Cuppen, MA Deij, J van Eupent, P Verwer, and E Vlieg. Crystal growth and morphology: New developments in an integrated hartman-perdok-connected net-roughening transition theory, supported by computer simulations. Cryst. Growth Des., 4(5):905–913, SEP-OCT 2004.
[2]SXM Boerrigter, GPH Josten, J van de Streek, FFA Hollander, JLHM Cuppen, P Bennema, and H Meekes. Monty: Monte carlo crystal growth on any crystal structure in any crystallographic orientation; application to fats. J. Phys. Chem. A, 108(27):5894–5902, JUL 8 2004.
[3]Piet Hartman and W. G. Perdok. On the relations between structure and morphology of crystals. i. Acta Crystallogr., 8:49–52, 1955.
[4]Piet Hartman and W. G. Perdok. On the relations between structure and morphology of crystals. ii. Acta Crystallogr., 8:521–524, 1955.
[5]Piet Hartman and W. G. Perdok. On the relations between structure and morphology of crystals. iii. Acta Crystallogr., 8:525–529, 1955.
[6]S. L. Mayo, B. D. Olafson, and W. A. Goddard III. Dreiding: A generic force field. J. Phys. Chem., 94:8897–8909, 1990.